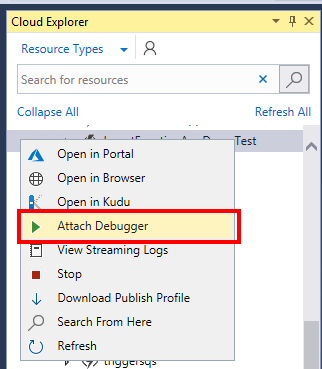
Sometimes it can be tricky to attach the Visual Studio debugger to a deployed Azure Functions app. For example if you use Cloud Explorer you can right click on the deployed Azure Function and choose Attach Debugger as the following screenshot shows:

While this may seem to work at first, you may experience a problem with your breakpoints actually being hit when function app code is executing with the message “The breakpoint will not currently be hit. No symbols have been loaded for this document”.

As an alternative to attaching via Cloud Explorer, you can try the following approach:
1 Log in to Azure Portal and navigate to your deployed function app.
2 Download the publish profile

3 Open the downloaded file
Make a note of the userName, userPWD and destinationAppUrl values.
4 Attach Visual Studio Debugger to Azure Function App
- Make sure your function app project is open in Visual Studio
- Make sure that you have deployed a debug version of the function app to Azure
- On the Debug menu choose Attach to Process..
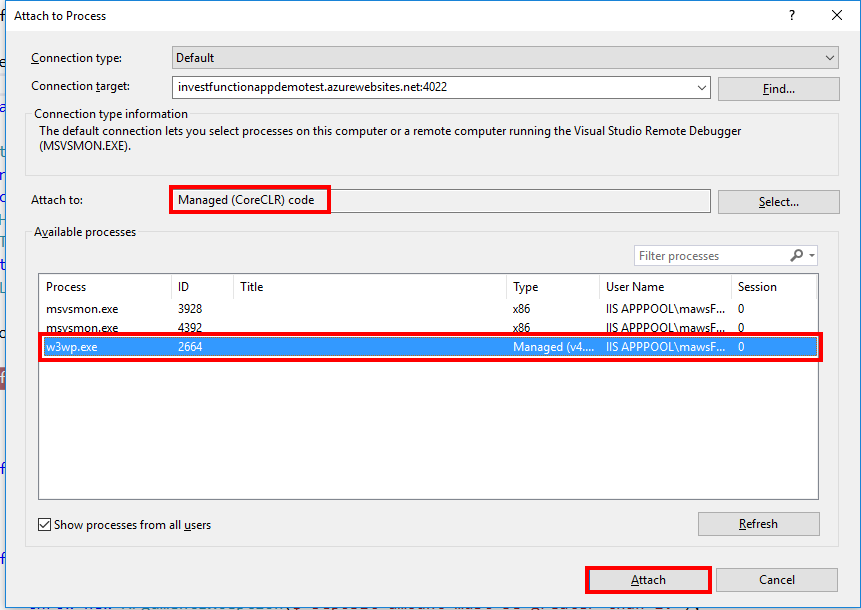
- For the Attach to value, click the Select.. button and un-tick everything except Managed (CoreCLR) code
- In the Connection target enter the destinationAppUrl (without the preceding http) followed by :4022 – for example: investfunctionappdemotest.azurewebsites.net:4022 – and hit Enter
- You should now see an Enter Your Credentials popup box, use the userName and userPWD from step 3 and click Ok
- Wait a few seconds for Visual Studio to do its thing
- Click the w3wp.exe process and the click the Attach button (see screenshot below) Be patient after clicking as it may take quite a while for all the debug symbols to load.

5 Set your breakpoints as desired

6 Invoke your function code and you should see your breakpoint hit
Once again this may take a while so be patient, you may also see “a remote operation is taking longer than expected”.

If you want to fill in the gaps in your C# knowledge be sure to check out my C# Tips and Traps training course from Pluralsight – get started with a free trial.


SHARE: