Sometimes it can be tricky to attach the Visual Studio debugger to a deployed Azure Functions app. For example if you use Cloud Explorer you can right click on the deployed Azure Function and choose Attach Debugger as the following screenshot shows:

While this may seem to work at first, you may experience a problem with your breakpoints actually being hit when function app code is executing with the message “The breakpoint will not currently be hit. No symbols have been loaded for this document”.

As an alternative to attaching via Cloud Explorer, you can try the following approach:
1 Log in to Azure Portal and navigate to your deployed function app.
2 Download the publish profile

3 Open the downloaded file
Make a note of the userName, userPWD and destinationAppUrl values.
4 Attach Visual Studio Debugger to Azure Function App
- Make sure your function app project is open in Visual Studio
- Make sure that you have deployed a debug version of the function app to Azure
- On the Debug menu choose Attach to Process..
- For the Attach to value, click the Select.. button and un-tick everything except Managed (CoreCLR) code
- In the Connection target enter the destinationAppUrl (without the preceding http) followed by :4022 – for example: investfunctionappdemotest.azurewebsites.net:4022 – and hit Enter
- You should now see an Enter Your Credentials popup box, use the userName and userPWD from step 3 and click Ok
- Wait a few seconds for Visual Studio to do its thing
- Click the w3wp.exe process and the click the Attach button (see screenshot below) Be patient after clicking as it may take quite a while for all the debug symbols to load.

5 Set your breakpoints as desired

6 Invoke your function code and you should see your breakpoint hit
Once again this may take a while so be patient, you may also see “a remote operation is taking longer than expected”.

If you want to fill in the gaps in your C# knowledge be sure to check out my C# Tips and Traps training course from Pluralsight – get started with a free trial.


SHARE:
In a previous post I wrote about Customising the Appearance of Debug Information in Visual Studio with the DebuggerDisplay Attribute. In addition to controlling the high level debugger appearance of an object we can also exert a lot more control over how the object appears in the debugger by using the DebuggerTypeProxy attribute.
For example, suppose we have the following (somewhat arbitrary) class:
class DataTransfer
{
    public string Name { get; set; }
    public string ValueInHex { get; set; }
}
By default, in the debugger it would look like the following:

To customize the display of the object members, the DebuggerTypeProxy attribute can be applied.
The first step is to create a class to act as a display proxy. This class takes the original object as part of the constructor and then exposes the custom view via public properties.
For example, suppose that we wanted a decimal display of the hex number that originally is stored in a string property in the original DataTransfer object:
class DataTransferDebugView
{
    private readonly DataTransfer _data;

    public DataTransferDebugView(DataTransfer data)
    {
        _data = data;
    }

    public string NameUpper => _data.Name.ToUpperInvariant();
    public string ValueDecimal
    {
        get
        {
            bool isValidHex = int.TryParse(_data.ValueInHex, System.Globalization.NumberStyles.HexNumber, null, out var value);

            if (isValidHex)
            {
                return value.ToString();
            }

            return "INVALID HEX STRING";
        }
    }
}
Once this view object is defined, it can be selected by decorating the DataTransfer class with the DebuggerTypeProxy attribute as follows:
[DebuggerTypeProxy(typeof(DataTransferDebugView))]
class DataTransfer
{
    public string Name { get; set; }
    public string ValueInHex { get; set; }
}
Now in the debugger, the following can be seen:

Also notice in the preceding image, that the original object view is available by expanding the Raw View section.
To learn more about C# attributes and even how to create your own custom ones, check out my C# Attributes: Power and Flexibility for Your Code Pluralsight course.You can start watching with a Pluralsight free trial.
SHARE:
One way to run automated tests is to use Visual Studio’s Test Explorer. Test Explorer can be found under the Test –> Windows –> Test Explorer menu items.
In this article we’ll look at how to manage the list of tests using grouping and also how to specify custom search filter expressions.

Grouping Tests
There are a number of ways to group tests in Test Explorer, at the highest structural level we can group by project.
To select a group by method, click the drop down arrow as show in the following screenshot:

With the grouping set to Project, the test list looks as follows:

The next structural grouping is Class:

The final structural grouping is by Namespace:

There are a number of non-structural groupings.
Group by Duration:

Group by Outcome:

…and group by Traits:

Filtering Tests
Custom filters can also be applied.
For example by file path:

Other search examples include:
- Trait:"Smoke Test"
- Message:"System.Exception"
- Class1
- Outcome:"Passed"
- Outcome:"Failed"
Subsets can also be excluded by prefixing the type of filter with a -. For example to show all tests in Class1 except failed tests: Class:"TestClass1" -Outcome:"Passed".
To learn xUnit.net check out my xUnit.net course from Pluralsight - You can start watching with a Pluralsight free trial.
SHARE:
When your main app is running via Visual Studio, when there is a problem you’ll get an exception and Visual Studio will break into the debugger to help you figure out the problem.
There’s a couple of scenarios that are a little more difficult to debug but are easy enough to do once you know how to access it in Visual Studio.
The two things that can be problematic are debugging background agents and debug share to functionality if your app is a share target. If you share to your app if it’s not already running you may not have things like dependency injection registered or other setup code. This is because a differnt code path executes when you launch the app normally to when you launch via share charm. The other thing is debugging background agents, if you are (for example) using a timed agent that executes every hour you don’t want to wait around for an hour before you can test.
Debugging Apps Launched from Share Charm
This technique also applies if you want to start debugging when you start your app from the desktop, even if you didn’t start it from Visual Studio.
Make sure your app is built and deployed: if you just want to deploy but not launch go to the Build menu and choose Deploy Solution.
At this point your app is freshly installed but is not running.
More...
SHARE:
Using Visual Studio 2013 Update 2 and the Shared Project Manager Extension it’s possible to use shared projects in non Universal App projects.
This video shows a brief intro to shared projects in the context of Universal Apps and then how linked files work and how to refactor them to shared project.
As the documentation states: “Please note that this extension is preview technology and may have unforseen issues in the projects and solutions that it creates.”
Check out the video on YouTube or Vimeo.
SHARE:

How often do you actually use CapsLock – deliberately that is?
Most of the time I hit it accidentally then END UP SHOUTING in emails or Tweets. It’s especially a pain sometimes while coding…
We can stop CapsLock from doing it’s capsy thing using AutoHotkey.
The following remaps the CapsLock key to nothing:
Capslock::
Now the CapsLock key doesn’t do anything, the caps LED on the keyboard doesn’t even light up.
We could also remap CapsLock to F6, so we can hit CapsLock in Visual Studio to do a build:
Capslock::F6
This will trigger F6 in all applications, not just in Visual Studio.
To limit the remapping to only when we are in Visual Studio:
SetTitleMatchMode, 2
#IfWinActive Microsoft Visual Studio
Capslock::F6
#IfWinActive
Here the remapping only occurs if the window title contains “Microsoft Visual Studio”. (The SetTitleMatchMode command tells AutoHotKey to look in any part of the title for the match.
Now, outside of Visual Studio, CapsLock behaves normally, but inside VS it will perform a build.
To learn more about AutoHotkey, check out my Pluralsight course: Personal Productivity & Performance Tools for Windows Developers.
SHARE:
Sometimes the display and formatting of information in the Visual Studio debugger is less than optimal.
The DebuggerDisplay attribute allows us to customise how an object is portrayed in the debug window.
Imagine a Person object p with an AgeInYears and an Name property.
By default, in the debugger this would look like:

At the “root” level for the object we just get the type name.
If we override ToString() then we would get that output here instead.
If we want to override ToString() but have a different output at the root debug level we can apply the DebuggerDisplay attribute at the class level:
[DebuggerDisplay("This person is called {Name} and is {AgeInYears} years old")]
class PersonWithDebuggerDisplay
{
    [DebuggerDisplay("{AgeInYears} years old")]
    public int AgeInYears { get; set; }

    public string Name { get; set; }
}
In the string we supply to the DebuggerDisplay attribute we can reference properties, fields, and methods in the class by wrapping them in {}.
This produces the following in the debugger:

Note that in the sample code above, the DebuggerDisplay attribute is also added to the AgeInYears property which produces the following when the object is expanded in the debugger:

The DebuggerDisplay attribute can be applied to:
- Classes
- Structs
- Delegates
- Enums
- Fields
- Properties
- Assemblies
While this is not something we’d use on every class as a matter of course, it may be helpful when we are doing a lot of debug work and we want to make life easier for ourselves. For more info on usage check out MSDN.
If you want to fill in the gaps in your C# knowledge be sure to check out my C# Tips and Traps training course from Pluralsight – get started with a free trial.
SHARE:
Disclaimer: some of the software used below is pre-release, use at your own risk...
This article assumes basic knowledge of writing C# and using Visual Studio - it doesn't assume any prior knowledge of Raspberry Pi or Linux.
My Parts List
You can find a list of verified peripherals here, below are the specifics of what I'm using successfully:
- Raspberry Pi Model B (from element14 Australia)
- 1 metre high speed HDMI lead (from element14 Australia)
- Microsoft Comfort Curve 3000 USB keyboard;
- Logitech M100 USB mouse;
- SanDisk 16GB Ultra SDHC Card, Class 10, "up to 30 MB/s 200X"
- Nokia AC-USB phone charger (output: DC 5 volt 1 amp*)
- Cat 5 Ethernet cable (wired to Belkin wireless bridge/extender)
* It's important to have a sufficiently powerful supply.
Preparing the Operating System
Download Soft-float Debian “wheezy” image from http://www.raspberrypi.org/downloads.
Extract the .img from the zip file.
Download Win32 Disk Imager http://www.softpedia.com/get/CD-DVD-Tools/Data-CD-DVD-Burning/Win32-Disk-Imager.shtml (make sure you get the correct link as there's lots of advertising and other download links on the page).
More...
SHARE:
Installing
Download and install VS 2010 RC (phone tools below don't currently work with RTM ver of VS 2010):
http://www.microsoft.com/downloads/details.aspx?FamilyID=301c97f3-aecf-42ca-966a-b8d7304f40b0&displaylang=en
Download and install vs 2010 express for windows phone ctp:
http://www.microsoft.com/express/Downloads/#2010-Visual-Phone
Developing
Open VS 2010 RC
New --> Project
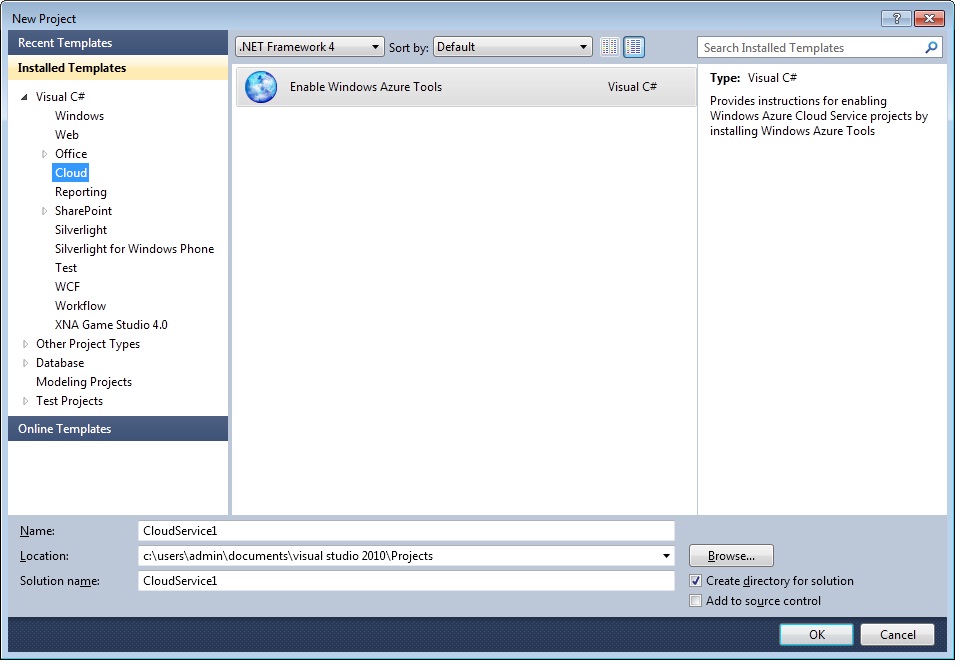
Double Click Enable Windows Azure Tools and follow instructions to install Azure tools ( once install starts you will have to quit VS2010)
Reopen VS2010
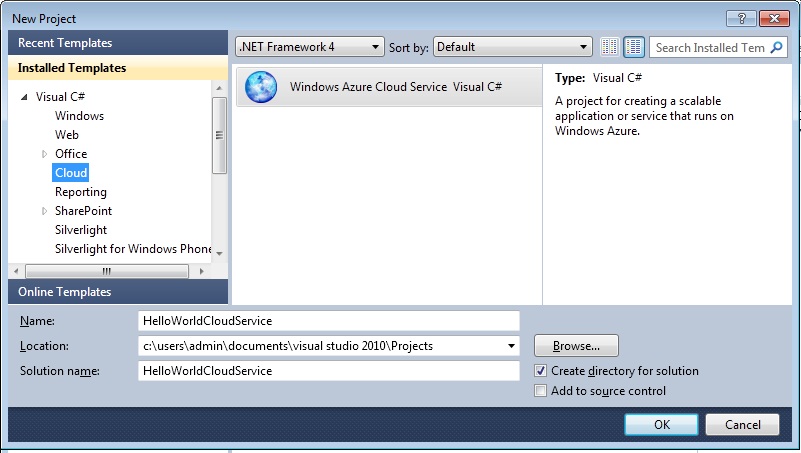
Create new proj Cloud --> Windows Azure Cloud Service
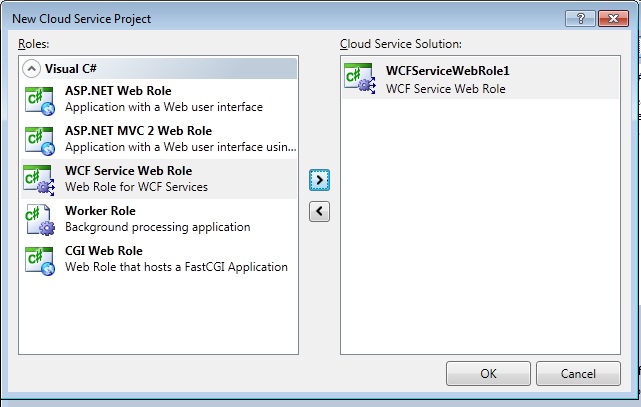
Add WCF Service Web Role
R click Service1 Refactor --> Rename to HelloWorldService
R Click definition for Iservice1 Refactor --> Rename to IHelloWorldService
Change interface and service class to:
using System;
using System.Collections.Generic;
using System.Linq;
using System.Runtime.Serialization;
using System.ServiceModel;
using System.ServiceModel.Web;
using System.Text;
namespace WCFServiceWebRole1
{
// NOTE: You can use the "Rename" command on the "Refactor" menu to change the interface name "IService1" in both code and config file together.
[ServiceContract]
public interface IHelloWorldService
{
[OperationContract]
string SayHello(string name);
}
}
using System;
using System.Collections.Generic;
using System.Linq;
using System.Runtime.Serialization;
using System.ServiceModel;
using System.ServiceModel.Web;
using System.Text;
namespace WCFServiceWebRole1
{
// NOTE: You can use the "Rename" command on the "Refactor" menu to change the class name "Service1" in code, svc and config file together.
public class HelloWorldService : IHelloWorldService
{
public string SayHello(string name)
{
return String.Format("Hello {0}.", name);
}
}
}
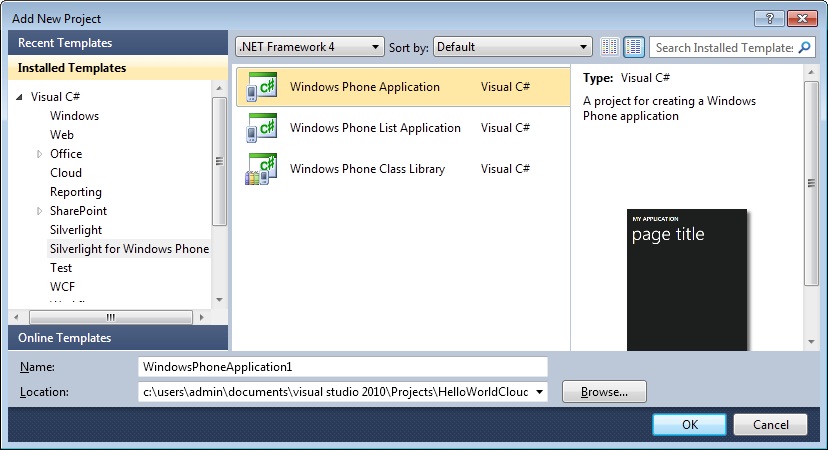
Add a Windows Phone Application project to the solution.
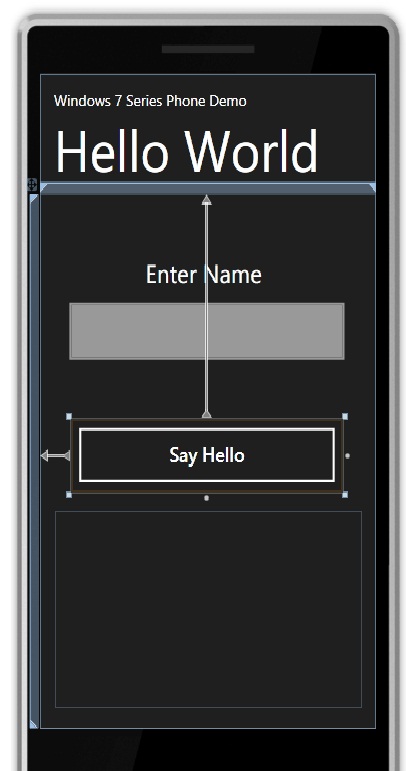
Create a user interface that looks similar to this (notice how the UI elements are pre-styled to the Win 7 phone look and feel codename 'Metro':
Here's where it gets a bit messy. VS2010 RC phone app project doesn't have an Add Service Reference, so: Save All, then r click Service1.svc --> Preview In Browser, then copy the URL - leave IE open
Open VS 2010 Express, open the solution (there might be some errors, but click ok to them), when the solution opens, add service reference to the Windows Mobile application and paste the URL into the add service box and click ok. Save all and close VS 2010 Express.
Go back to VS 2010 RC and click reload solution if you get prompted.
Now we can double click our button to go to the code behind and type:
private void button1_Click(object sender, RoutedEventArgs e)
{
ServiceReference1.HelloWorldServiceClient proxy = new ServiceReference1.HelloWorldServiceClient();
// declare callback as statement lambda
proxy.SayHelloCompleted += (s2, e2) =>
{
txtGreeting.Text = e2.Result;
};
// call 'Azure' service
proxy.SayHelloAsync(txtName.Text);
}
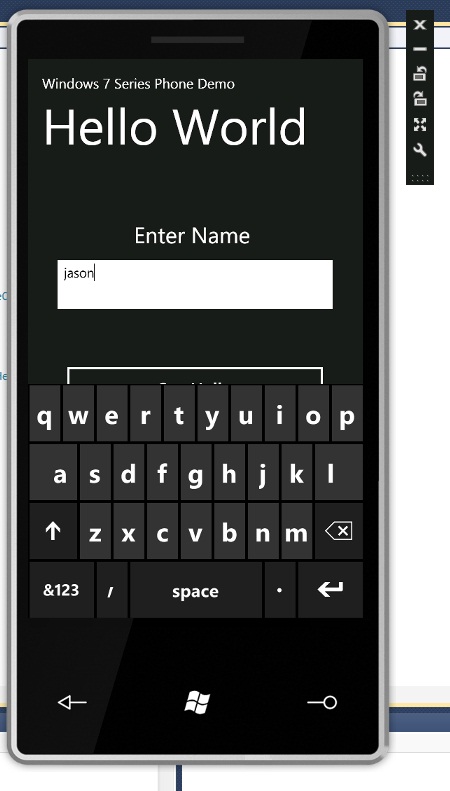
Now hit f5 and wait for the Windows Phone Emulator to start (it may take a little time...) then if u click on the button a keyboard will pop up:
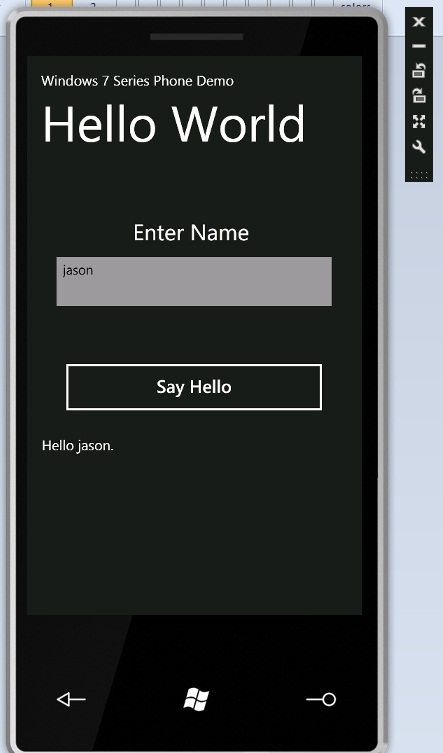
Type you name then click the Say Hello button, you should then see the "Hello ...." result displayed that was returned from the Azure service:
It's pretty amazing that a sole developer can now create a worldwide Win 7 phone app which connects to scalable set of services in Azure all from within VS2010.
SHARE: