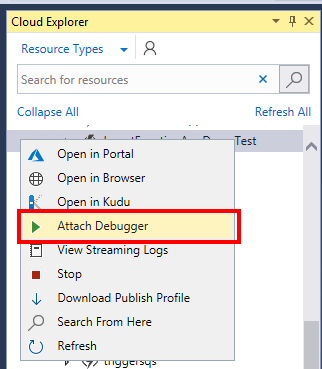
Sometimes it can be tricky to attach the Visual Studio debugger to a deployed Azure Functions app. For example if you use Cloud Explorer you can right click on the deployed Azure Function and choose Attach Debugger as the following screenshot shows:

While this may seem to work at first, you may experience a problem with your breakpoints actually being hit when function app code is executing with the message “The breakpoint will not currently be hit. No symbols have been loaded for this document”.

As an alternative to attaching via Cloud Explorer, you can try the following approach:
1 Log in to Azure Portal and navigate to your deployed function app.
2 Download the publish profile

3 Open the downloaded file
Make a note of the userName, userPWD and destinationAppUrl values.
4 Attach Visual Studio Debugger to Azure Function App
- Make sure your function app project is open in Visual Studio
- Make sure that you have deployed a debug version of the function app to Azure
- On the Debug menu choose Attach to Process..
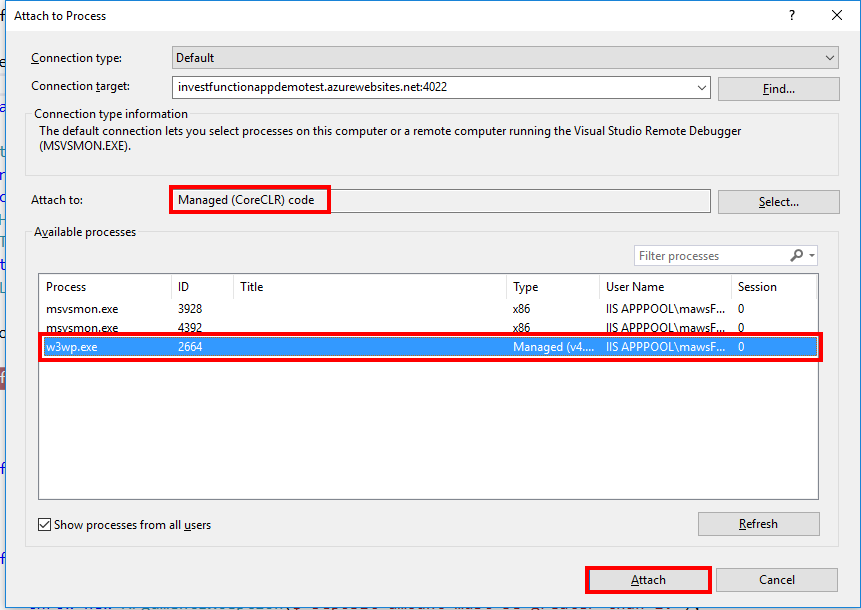
- For the Attach to value, click the Select.. button and un-tick everything except Managed (CoreCLR) code
- In the Connection target enter the destinationAppUrl (without the preceding http) followed by :4022 – for example: investfunctionappdemotest.azurewebsites.net:4022 – and hit Enter
- You should now see an Enter Your Credentials popup box, use the userName and userPWD from step 3 and click Ok
- Wait a few seconds for Visual Studio to do its thing
- Click the w3wp.exe process and the click the Attach button (see screenshot below) Be patient after clicking as it may take quite a while for all the debug symbols to load.

5 Set your breakpoints as desired

6 Invoke your function code and you should see your breakpoint hit
Once again this may take a while so be patient, you may also see “a remote operation is taking longer than expected”.

If you want to fill in the gaps in your C# knowledge be sure to check out my C# Tips and Traps training course from Pluralsight – get started with a free trial.


SHARE:
When your main app is running via Visual Studio, when there is a problem you’ll get an exception and Visual Studio will break into the debugger to help you figure out the problem.
There’s a couple of scenarios that are a little more difficult to debug but are easy enough to do once you know how to access it in Visual Studio.
The two things that can be problematic are debugging background agents and debug share to functionality if your app is a share target. If you share to your app if it’s not already running you may not have things like dependency injection registered or other setup code. This is because a differnt code path executes when you launch the app normally to when you launch via share charm. The other thing is debugging background agents, if you are (for example) using a timed agent that executes every hour you don’t want to wait around for an hour before you can test.
Debugging Apps Launched from Share Charm
This technique also applies if you want to start debugging when you start your app from the desktop, even if you didn’t start it from Visual Studio.
Make sure your app is built and deployed: if you just want to deploy but not launch go to the Build menu and choose Deploy Solution.
At this point your app is freshly installed but is not running.
More...
SHARE:
Sometimes the display and formatting of information in the Visual Studio debugger is less than optimal.
The DebuggerDisplay attribute allows us to customise how an object is portrayed in the debug window.
Imagine a Person object p with an AgeInYears and an Name property.
By default, in the debugger this would look like:

At the “root” level for the object we just get the type name.
If we override ToString() then we would get that output here instead.
If we want to override ToString() but have a different output at the root debug level we can apply the DebuggerDisplay attribute at the class level:
[DebuggerDisplay("This person is called {Name} and is {AgeInYears} years old")]
class PersonWithDebuggerDisplay
{
    [DebuggerDisplay("{AgeInYears} years old")]
    public int AgeInYears { get; set; }

    public string Name { get; set; }
}
In the string we supply to the DebuggerDisplay attribute we can reference properties, fields, and methods in the class by wrapping them in {}.
This produces the following in the debugger:

Note that in the sample code above, the DebuggerDisplay attribute is also added to the AgeInYears property which produces the following when the object is expanded in the debugger:

The DebuggerDisplay attribute can be applied to:
- Classes
- Structs
- Delegates
- Enums
- Fields
- Properties
- Assemblies
While this is not something we’d use on every class as a matter of course, it may be helpful when we are doing a lot of debug work and we want to make life easier for ourselves. For more info on usage check out MSDN.
If you want to fill in the gaps in your C# knowledge be sure to check out my C# Tips and Traps training course from Pluralsight – get started with a free trial.


SHARE:
You can use Microsoft Service Trace Viewer (SvcTraceViewer.exe) to help diagnose problems with connections to your WCF services.
For example, if calling WCF service from the client using AJAX (or maybe AJAJ for JSON!) you might get a 500 Server Error, you set a breakpoint in you service but that is never hit, using SvcTraceViewer.exe you can attempt to get some more info.
Add the following to your app\web.config:
 <system.diagnostics>

  <sources>

    <source name="System.ServiceModel" switchValue="Verbose,ActivityTracing"

      propagateActivity="true">

      <listeners>

        <add type="System.Diagnostics.DefaultTraceListener" name="Default">

          <filter type="" />

        </add>

        <add name="ServiceModelTraceListener">

          <filter type="" />

        </add>

      </listeners>

    </source>

    <source name="System.ServiceModel.MessageLogging" switchValue="Verbose,ActivityTracing">

      <listeners>

        <add type="System.Diagnostics.DefaultTraceListener" name="Default">

          <filter type="" />

        </add>

        <add name="ServiceModelMessageLoggingListener">

          <filter type="" />

        </add>

      </listeners>

    </source>

  </sources>

  <sharedListeners>

    <add initializeData="MyWCFTraceLog.svclog"

      type="System.Diagnostics.XmlWriterTraceListener, System, Version=2.0.0.0, Culture=neutral, PublicKeyToken=b77a5c561934e089"

      name="ServiceModelTraceListener" traceOutputOptions="Timestamp">

      <filter type="" />

    </add>

    <add initializeData="MyWCFTraceLog.svclog"

      type="System.Diagnostics.XmlWriterTraceListener, System, Version=2.0.0.0, Culture=neutral, PublicKeyToken=b77a5c561934e089"

      name="ServiceModelMessageLoggingListener" traceOutputOptions="Timestamp">

      <filter type="" />

    </add>

  </sharedListeners>

  <trace autoflush="true" />

</system.diagnostics>
You can then launch SvcTraceViewer.exe from the Visual Studio command prompt, File-->Open and choose the log file (MyWCFTraceLog.svclog in the above config). You can supply a full path to the log file, e.g.:
<add initializeData="c:\temp\MyWCFLogFiles\MyFooApp\MyWCFTraceLog.svclog"
SHARE: